New: temperature, fans, power supplies and SSD health per server. View hardware health

Try it free
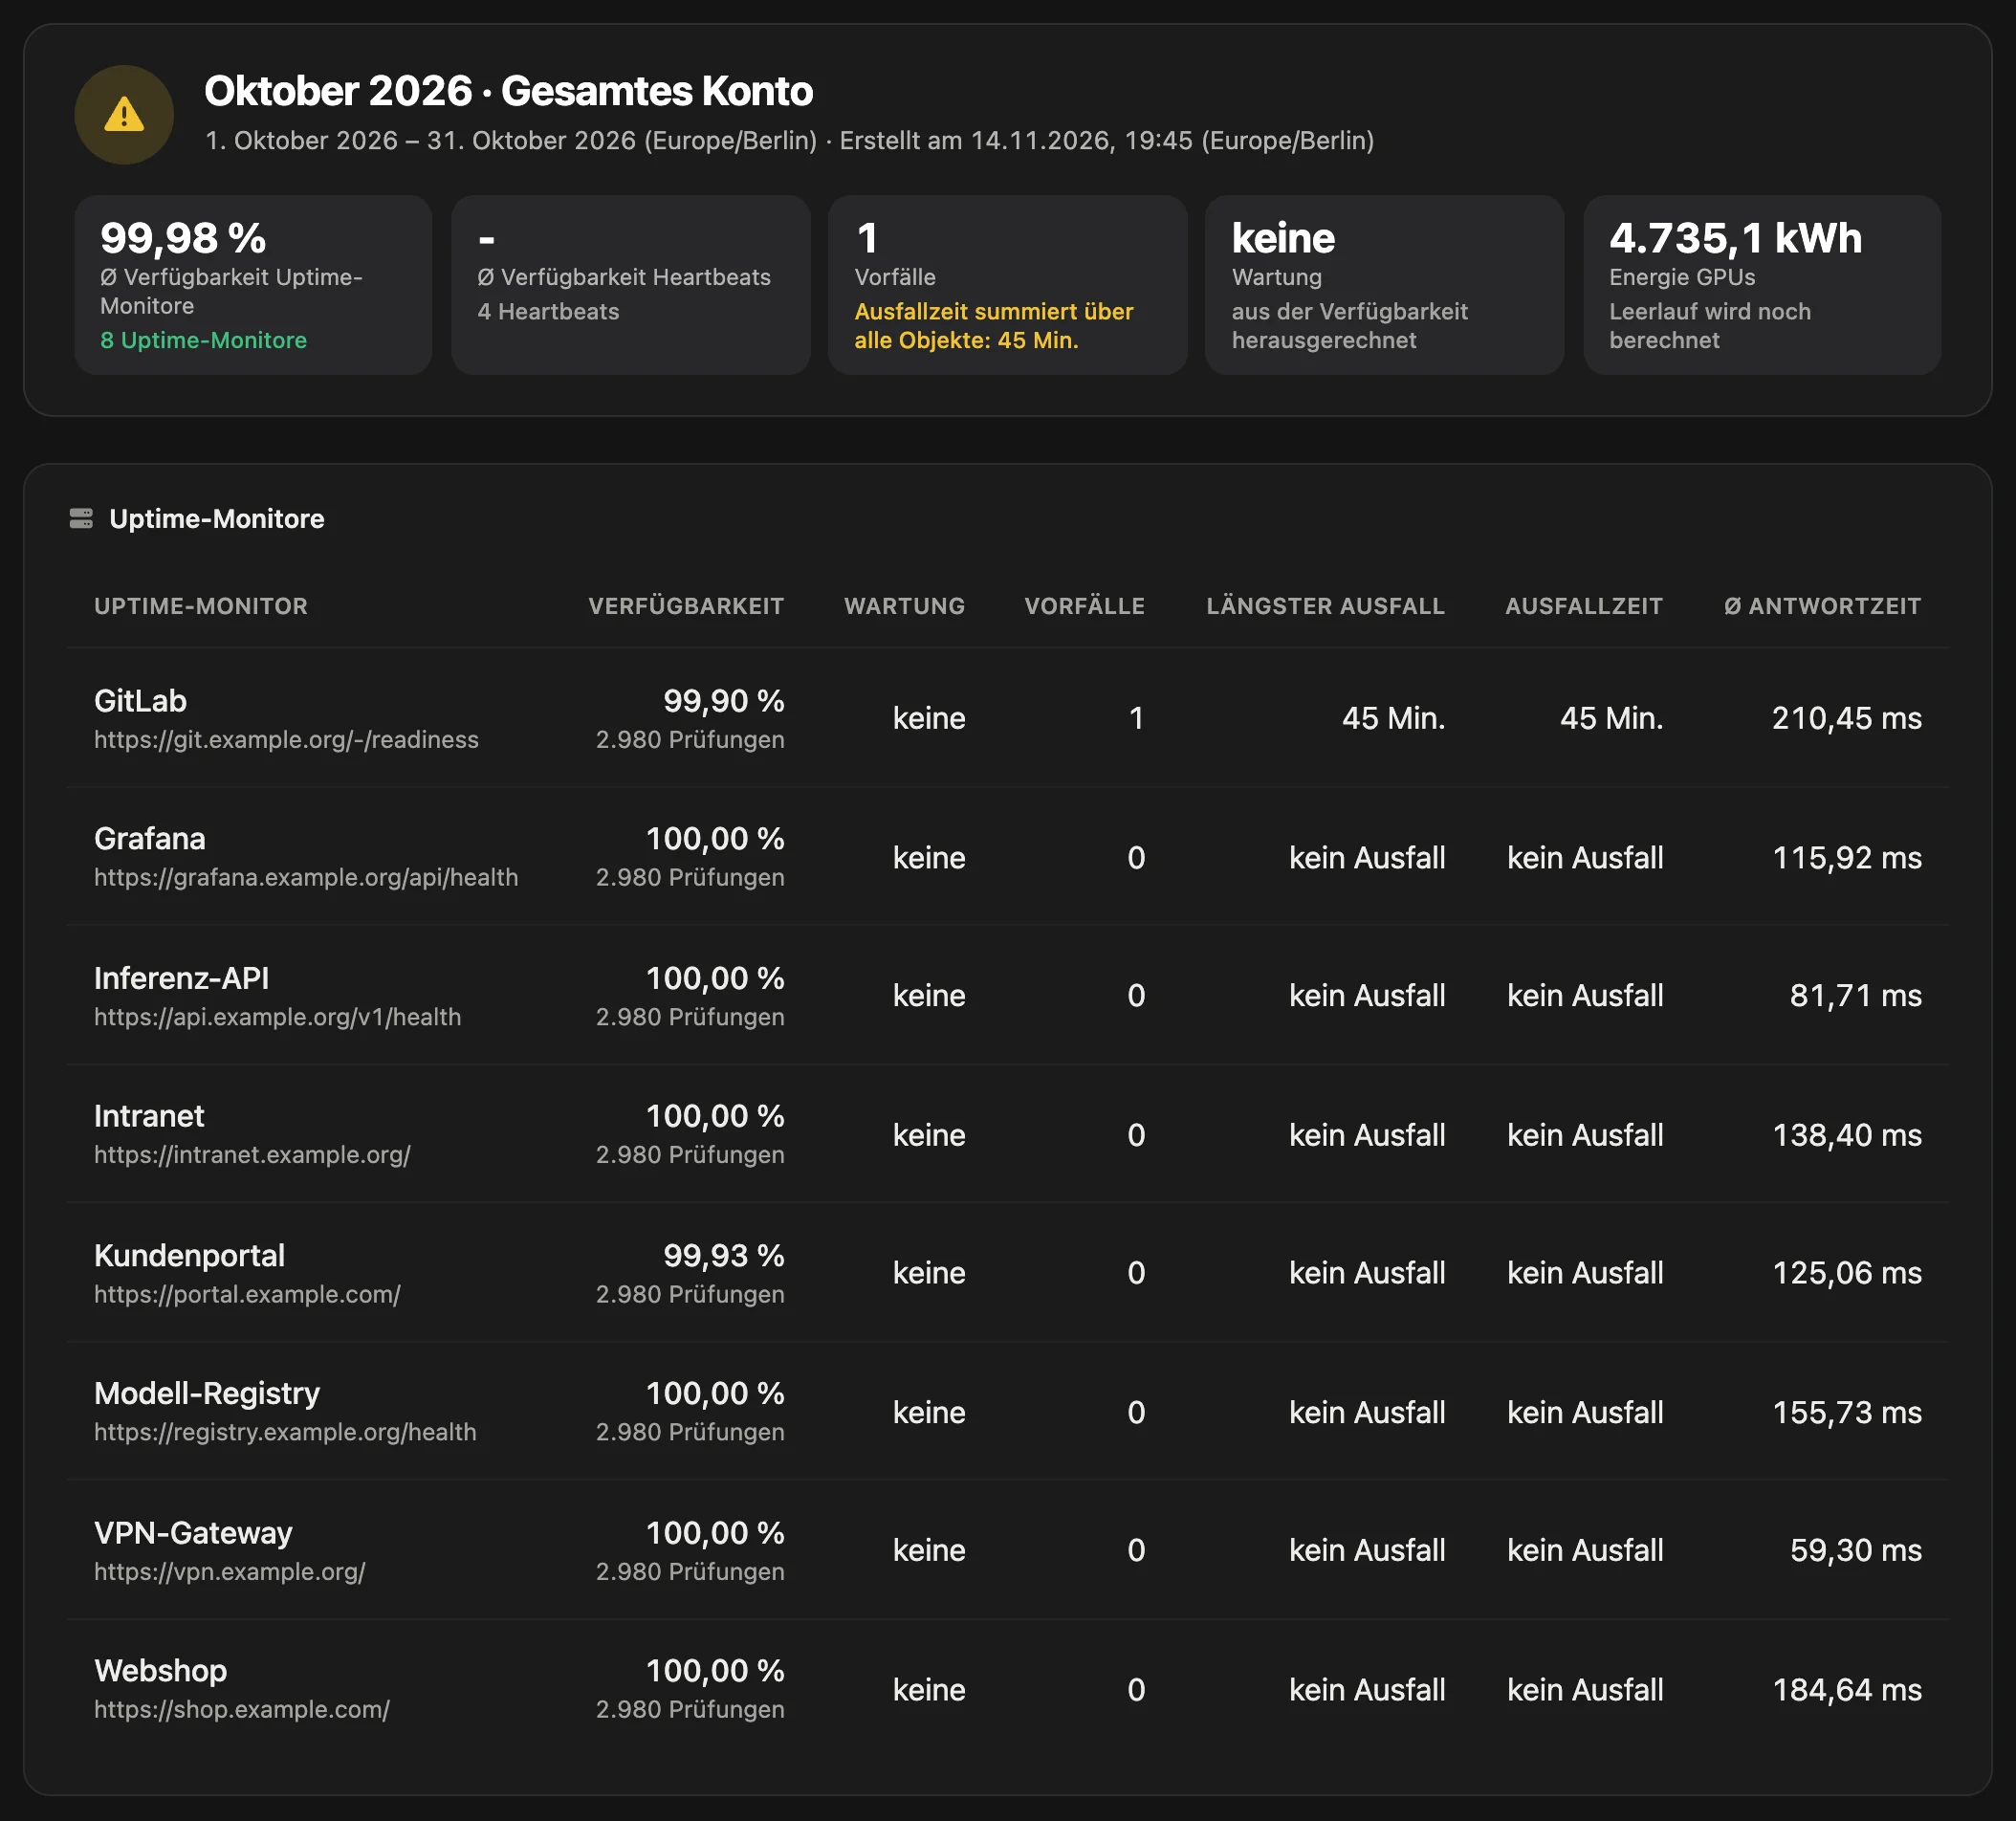
SLA and monthly report for October 2026 in the PeakNode portal: 99.98% availability of the uptime monitors, one incident with 45 minutes of downtime and 4,735.1 kWh of GPU energy, below per uptime monitor the availability, incidents, longest outage, downtime and average response time.

At the end of the month, someone wants to know how often something went down and for how long. The PeakNode report answers that for your services and servers: availability, incidents with start and duration, downtime. You get it as a preview in the portal and as a PDF, and if you wish by email on the 1st of the month.

Screenshot from the portal with sample data (German interface).

What is SLA reports?

The PeakNode SLA and monthly report summarizes, for a calendar month or a custom period of up to 366 days: availability per uptime monitor (a service checked from outside) and heartbeat (a job’s sign of life), incidents with downtime, CPU and GPU utilization of the servers, GPU energy, idle time and idle costs, upcoming SSL and domain expirations and the maintenance times. It is available as a preview in the portal and as a PDF, and if you wish by email on the 1st of the month.

What you get with the report

One report per account or per project. It does not dress up the numbers and explains at the end how each figure is derived.

Month, custom period or one project

The default is the previous month. You can choose the months for which measurement data is still available, or a custom period of at most 366 days. Limited to a project, it gives you a separate report per customer.

Availability as the portal calculates it

Availability means successful checks divided by all checks in the period, for heartbeats on-time runs divided by all runs. There are no checks during maintenance, so maintenance time is excluded and shown in a separate column.

Incidents with start, end and duration

All incidents that touch the period are listed, up to 500 in the list. Downtime and longest outage only count the time within the period. If an incident started in the previous month, the list shows the full duration and next to it the part “within the period”.

Server utilization, energy and idle time

For each server monitor the report shows the average and peak of CPU and GPU utilization, the GPU energy in kWh and the idle time in GPU hours. With stored costs per GPU hour, the amount for idle time is added. The energy is that of the GPUs, not of the whole server.

Preview in the portal, PDF to pass on

The preview shows the report in the portal, “Download PDF” creates an A4 document with page numbers. The PDF requires the PDF export of your plan. Addresses of monitors and servers appear without embedded credentials.

Automatic delivery on the 1st of the month

If you wish, the previous month’s report goes out as a PDF on the 1st from 06:00 in your time zone, to the account address and to your own confirmed email channels, at most 10 recipients. Delivery requires the plan’s PDF export and can be limited to one project.

The “Uptime monitors” section in the report

Example

Uptime monitorAvailabilityMaintenanceIncidentsLongest outageDowntimeAvg. response time
Inference API99.95%2 h121 min21 min184 ms
Portal login100%2 h0no outageno outage96 ms
New service- (no checks in this period)none----

Columns as in the report. A monitor without checks in the period shows “-”, not “no outage”.

What the report contains

The sections in the order of the report. The notes at the end describe each calculation in one sentence.

SectionContentBasis
SummaryAvg. availability of the uptime monitors and the heartbeats, number of incidents with summed downtime, maintenance, GPU energy, idle timemean or sum of the individual objects
Uptime monitorsAvailability, maintenance, incidents, longest outage, downtime, avg. response timestored checks, response time only from successful ones
HeartbeatsAvailability, maintenance, incidents, longest outage, downtimeon-time runs divided by all runs
IncidentsUptime monitor or heartbeat, start, end, duration, within the periodincidents that touch the period, at most 500 rows
Servers and GPU nodesCPU usage avg. and peak, GPU usage avg. and peak, GPU energy, GPU idle time, agent reportsstored agent reports, idle below 5% utilization
SSL and domain expirations in the following monthDomain name, type (SSL certificate or domain registration), expirystored expiry dates as of the last check
Maintenance windowsMaintenance window, start, end, duration, affected objectsmaintenance periods actually in effect, not the planning
NotesCalculation of availability, incidents, server values and expirations, time zone, notice “Measurement data from ...”fixed text of the report

The report does not include hardware events such as Xid or ECC, NodeCare items or NodeGuard events. The report states the measured availability and does not compare it with a contractually agreed target. The downtime in the summary is the sum over all objects and can therefore be longer than the period.

Your first report in three steps

The report needs no setup of its own. It reads what your monitors record anyway.

  1. Choose the period

    Open “Reports” in the portal, choose a month or a custom period and, if needed, a project. Click “Show” to see the preview.

  2. Download the PDF

    With “Download PDF” you get the report as a file. Team members can also see the preview and the PDF.

  3. Switch on delivery

    Under “Automatic delivery”, choose the recipients. You add further addresses as an email channel; they are confirmed before the first delivery. Delivery is set up by the account owner, and nothing is sent retroactively.

What does the PeakNode SLA report contain?

Availability, incidents, longest outage, downtime and average response time per uptime monitor, the same without response time per heartbeat. Plus CPU and GPU utilization, GPU energy and idle time per server, the SSL and domain expirations of the following month and the maintenance times.

How does PeakNode calculate availability in the report?

As the share of successful checks among all checks in the period, for heartbeats as the share of on-time runs. It is the same calculation as in the portal and on the status page.

Do maintenance windows count as downtime in the SLA report?

No. During a maintenance window there are no checks, so these times do not count toward availability. The report shows the maintenance time per monitor in a separate column.

For which period can I create a report?

For any calendar month for which measurement data is still available, or for a custom period of at most 366 days. How far back the data goes depends on the plan’s data retention: 14 days in Proof of Concept, one year in Premium and Enterprise.

Can I create a separate report for each customer?

Yes, with projects. If a customer’s monitors are in one project, you limit the report to that project. How IT service providers use PeakNode for several customers is described on the page For IT service providers.

Why does the report say “Measurement data from” with a date?

Because your plan only stores checks, heartbeat runs and server reports for the retention period and deletes older ones. If a period reaches further back, all values of the report start on that date, including incidents, downtime and maintenance.

What is an SLA?

An SLA (service level agreement) is an agreement on the quality of a service, for example a committed availability per month and response times. The PeakNode SLA report provides the measured values for it: availability, incidents and downtime per monitor. Whether a value meets the agreement is for you to assess.

Is 99.99% uptime good?

It is a high target: 99.99% allows about 4 minutes of downtime in a 30-day month and about 53 minutes a year, 99.9% about 43 minutes a month. Whether it is good enough depends on what you have agreed with your users or customers. The PeakNode report shows the measured downtime per monitor, with maintenance listed separately, see uptime monitoring.

See the report for last month

Create an account, set up monitors, choose the period under “Reports”. The Proof of Concept plan is free.