New: temperature, fans, power supplies and SSD health per server. View hardware health

Try it free

Monitoring tells you when something has failed. NodeCare tells you earlier: when a drive will be full in three weeks if the trend continues, when a GPU runs hotter at the same power than in the previous month, or when a card’s correctable memory errors rise sharply. Every item states the finding, the numbers and the next step.

Sample data, wording as in the portal; names and values are placeholders. NodeCare gives recommendations and does not intervene in the server.

What is NodeCare?

NodeCare is the hardware early warning in PeakNode. 22 rules evaluate vendor values from the driver, the kernel log (system log), SMART and the BMC, along with the history of every component: GPUs, GPU memory, drives, memory, power supplies, fans and cooling. Every item states the finding, numbers, source and recommendation and sits in a maintenance plan with the stages “Act now”, “Plan maintenance” and “Watch”. NodeCare is included in every plan and does not interfere with the server. The individual GPU events are shown under hardware health.

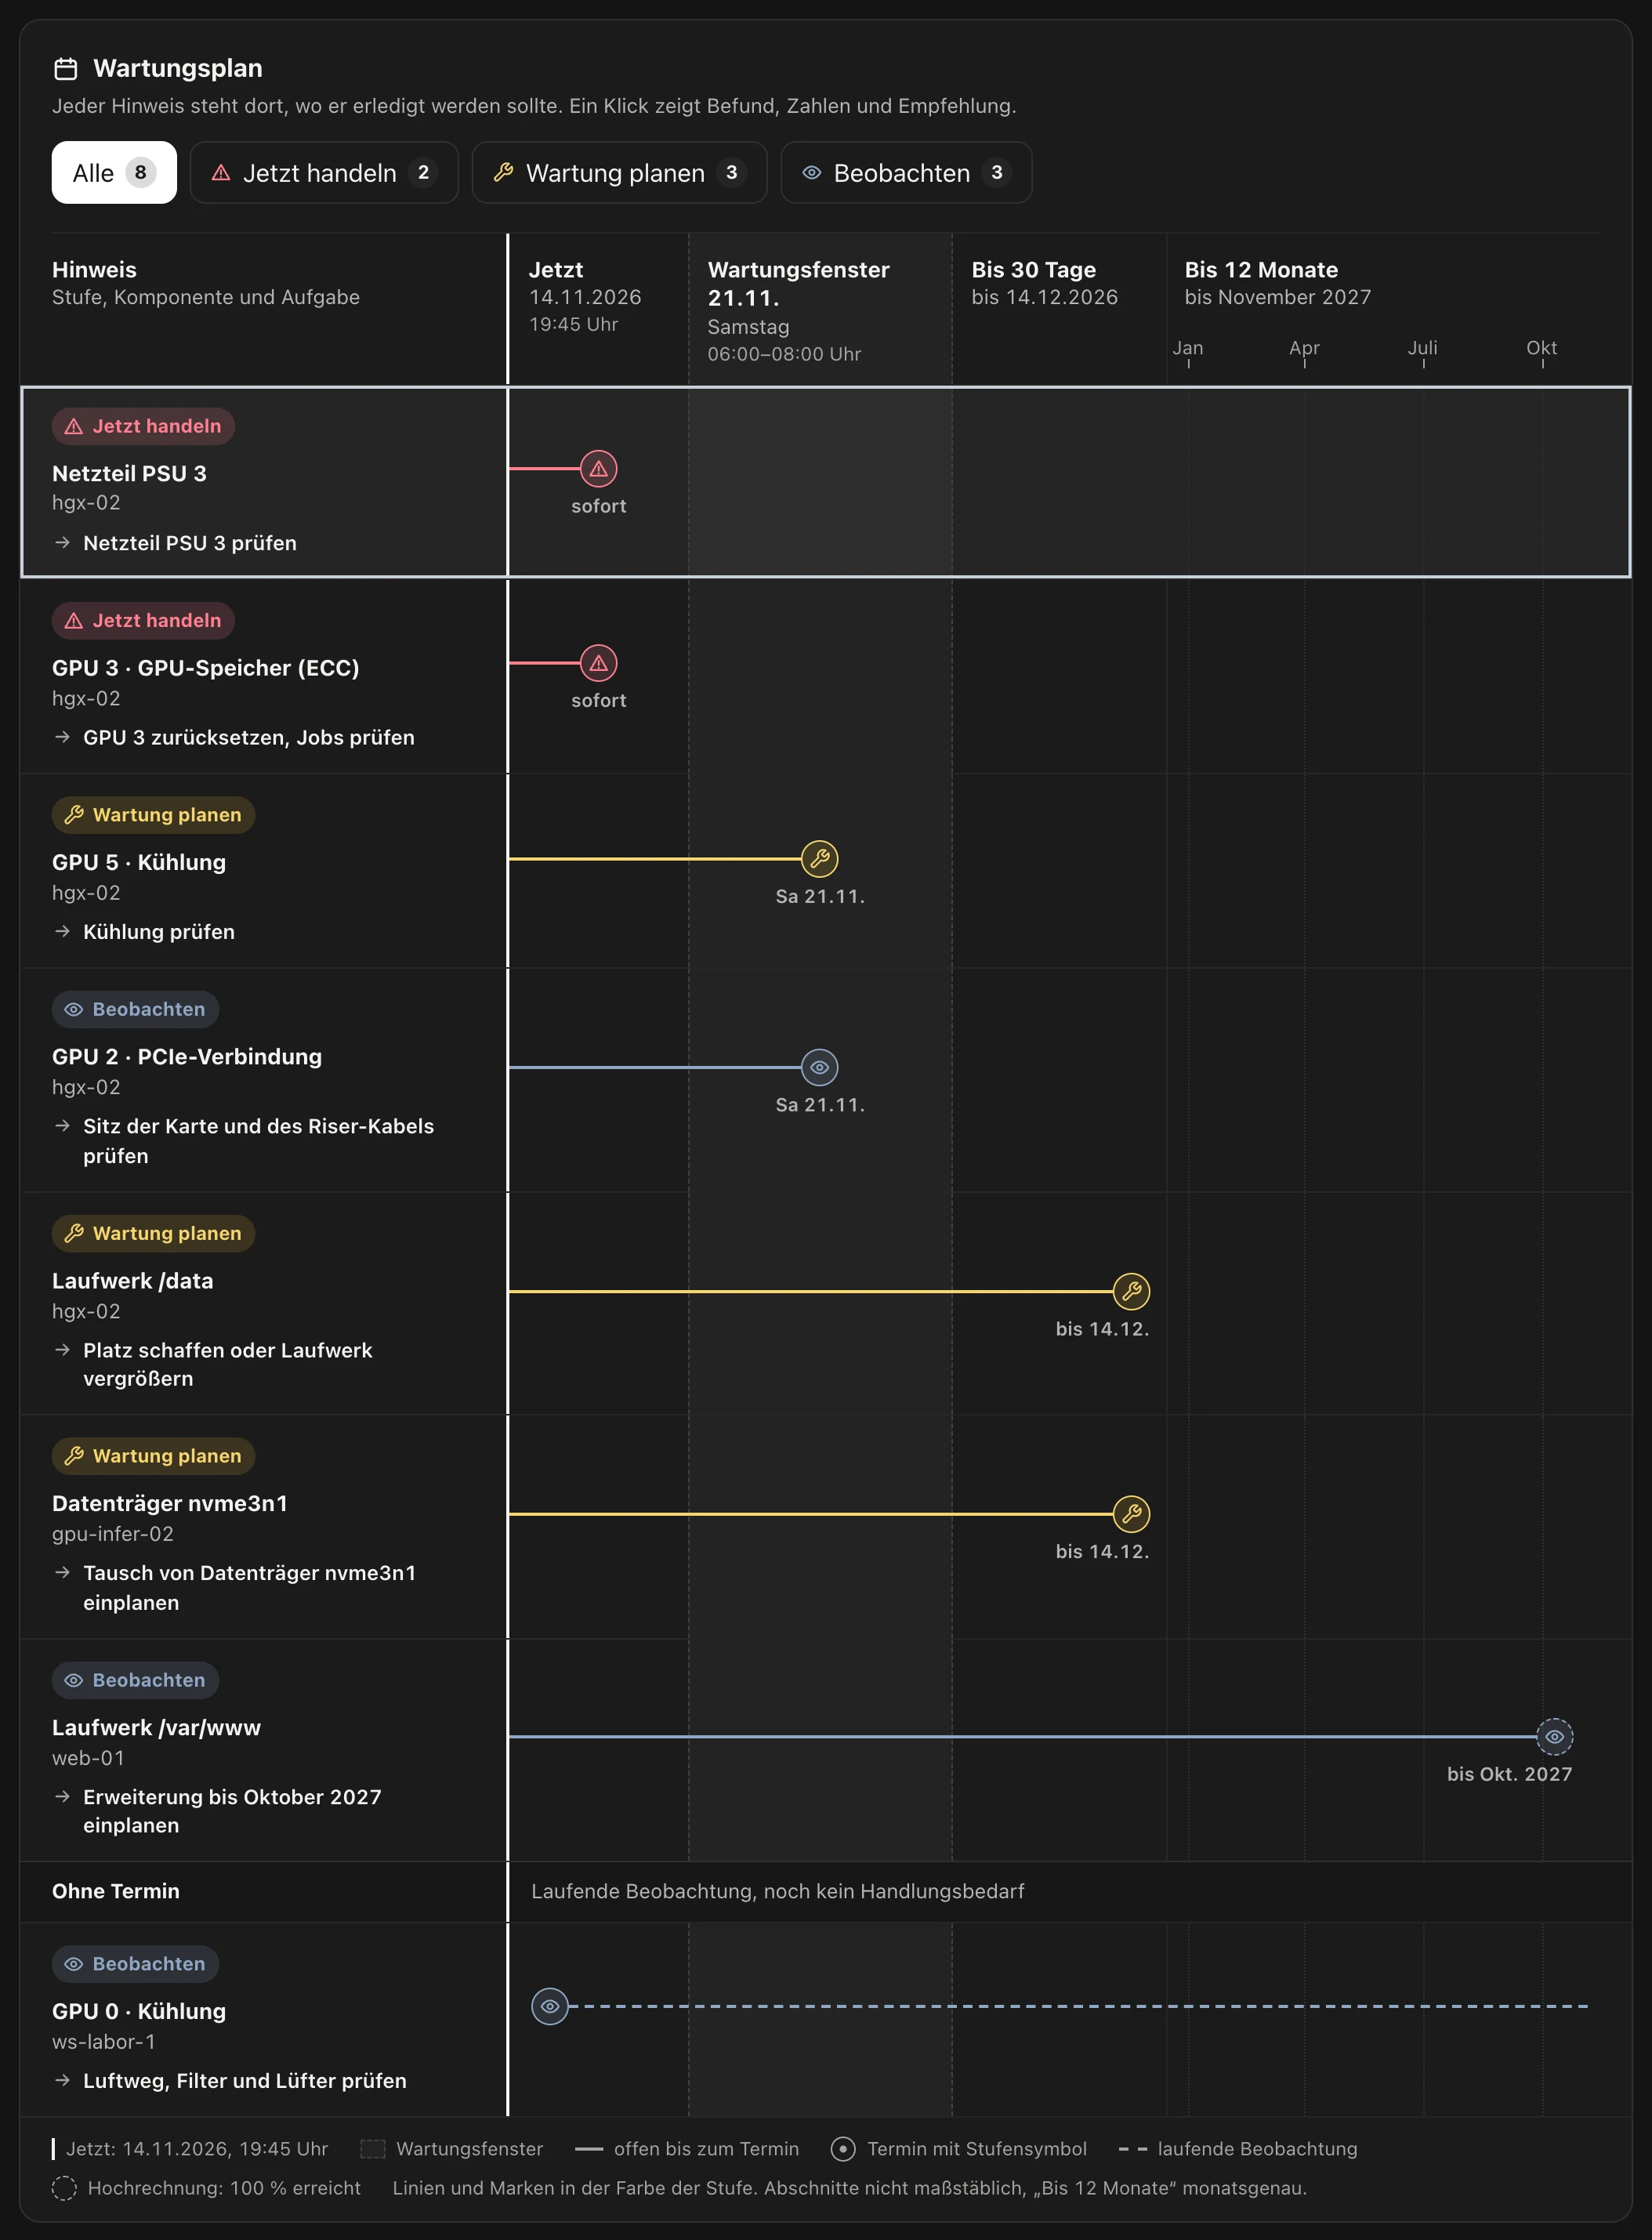
Maintenance plan in NodeCare: eight items with level, component and task on a timeline from “Now” through the maintenance window on 21 November to “Within 12 months”, among them power supply PSU 3 and GPU 3 with ECC errors (act now) as well as the drive /data and the disk nvme3n1 due by 14 December.
Screenshot from the portal with sample data (German interface).

NodeCare in the portal

  • Checks run with every agent report, rules based on history once an hour.
  • NodeCare needs no separate agent and no separate setup.
  • No score, no failure probability, no remaining lifetime of a GPU.

What you get with NodeCare

NodeCare evaluates what the server monitor’s agent reports anyway and turns it into a plan.

Four stages instead of an alert flood

Only “Act now” (failure or redundancy lost) notifies immediately. “Plan maintenance” (threshold reached or clear trend) arrives as a summary at 08:00 in the account’s time zone, “Watch” (deviation from its own normal history) appears only in the portal. Everything else is “Normal”.

Projection of when a drive will be full

From 95% usage the stage is “Act now”, from 85% “Plan maintenance”. Below 95%, NodeCare also projects when the drive will be full and shows the calculation in the item. Example, worded as in the portal: “/data is 87.0 % full. Increase of 0.60 percentage points per day (mean of 14 days), full on 2026-12-03 if the trend continues.”

Cooling compared with itself

NodeCare compares a GPU’s temperature at the same power: the last 7 days against the 30 days before. If the middle value (median) is 5 °C or more higher, an item is created, with the fan speed as an additional figure. The benchmark is the card in your chassis, not a value from the data sheet.

GPU memory errors put into context

Uncorrectable memory errors (ECC) and a failed replacement of faulty memory rows are “Act now”. A pending row remap and sharply rising correctable errors belong in the next maintenance window. If a card remaps further rows, NodeCare only watches this, because remapping is intended by the vendor.

Maintenance plan with dates

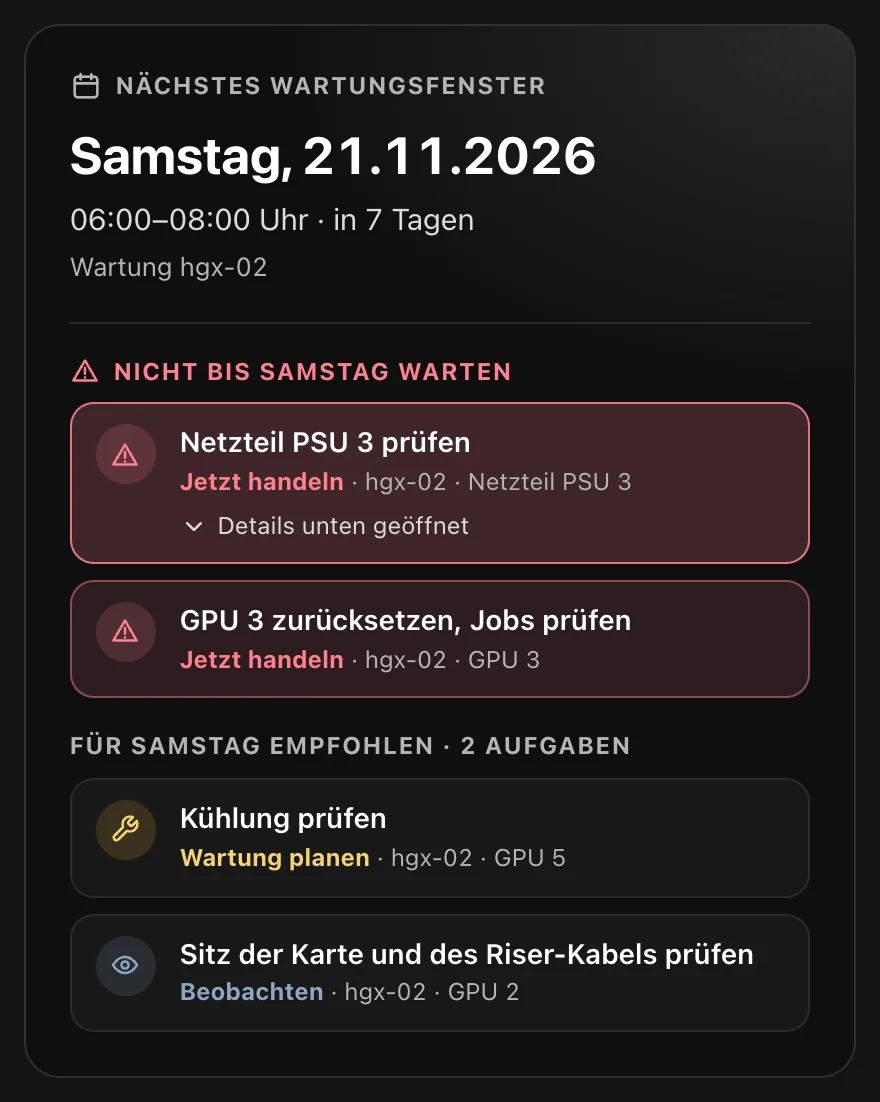
The plan is a timeline: Now, Maintenance window, Within 30 days, Within 12 months, No date. NodeCare assigns plannable tasks to the next maintenance window that covers the server and starts within the next 30 days. Without a window, the task appears under “Within 30 days” with the note “No maintenance window set up”.

Resolve, mute, claim

You mark an item as done or mute it for 7 days. “Act now” items cannot be muted; instead you can record the replacement of the card. For GPU items on ECC, remapped rows and Xid (the NVIDIA driver’s error codes), NodeCare creates a PDF record for the warranty claim with your reseller (RMA).

The 22 rules at a glance

Every rule has a fixed stage and names its source: vendor value, kernel log, measured value or comparison with its own history. Only “Drive filling up” has two stages, depending on the projection.

RuleWhat it evaluatesStage
GPU missingThe server reports fewer GPUs than expectedAct now
GPU driverThe driver delivers no values, nvidia-smi fails or does not respondAct now
Uncorrectable ECC errorsCounter since the driver was last loaded is above 0Act now
Row remapping failedRow remapping reports a failureAct now
Critical XidNew Xid message rated critical, except 63 and 92Act now
Drive fullUsage of a mount point at 95% or moreAct now
Memory: uncorrectable errorsA DIMM reports uncorrectable memory errors since the server last booted (EDAC)Act now
Drive criticalSMART reports an error, wear is at 95% or more, or the spare capacity is at 10% or lessAct now
Power supply failedThe BMC reports a power supply as failedAct now
Fan failedThe BMC reports a fan as failedAct now
Array degradedA software RAID (md) or ZFS pool is running with fewer drives than intendedAct now
Row remap pendingRow remapping pending or Xid 63Plan maintenance
Correctable ECC errors risingAt least 100 errors in 24 hours and ten times the daily mean of the 14 days before, or Xid 92Plan maintenance
Thermal throttlingThe GPU throttles due to temperature in three consecutive reportsPlan maintenance
Memory: corrected errors risingThe corrected memory errors of a DIMM are increasing (EDAC)Plan maintenance
Drive wearLifetime used at 80% or more (SMART)Plan maintenance
Drive filling upUsage at 85% or more, or projection: full within 30 days at most. Projection up to 12 months: WatchPlan maintenance or Watch
PCIe linkLink below the card’s maximum at a load of 50% or more, in three consecutive reportsWatch
Cooling over timeMedian temperature at the same power: last 7 days at least 5 °C above the 30 days beforeWatch
Further remapped rowsThe number of remapped memory rows has increasedWatch
Xid clusterAt least two Xid messages without a critical rating within 7 daysWatch
CPU cooling over timeThe CPU runs hotter at comparable load than in the 30 days beforeWatch

The rules on ECC, remapped rows, PCIe, throttling and Xid require the Linux agent and NVIDIA GPUs; the rules on drive usage apply with every agent. The rules on memory, drive health, power supplies, fans, arrays and CPU temperature require the Linux agent version 11 or later and apply where the system provides the values (EDAC, SMART, BMC). An item closes by itself once the condition has no longer applied for 24 hours, for six rules only after 2 or 7 days. If the server does not report, nothing counts as resolved.

Set up in three steps

NodeCare is active as soon as a server monitor reports. The two further steps make the plan useful.

  1. Server monitor with a current agent

    Create a server monitor and install the agent. Older agents without extended GPU values or a drive list are listed by NodeCare under “No data”, with a note to update the agent.

  2. Create a maintenance window

    With a maintenance window, NodeCare assigns plannable tasks to a date and shows what cannot wait that long.

  3. Check channels and hardware alert

    NodeCare uses the server monitor’s notification channels. GPU items are only sent if “Alert on hardware events” is switched on there, both immediately and in the summary. Drive items are sent regardless of this switch.

Frequently asked
questions about NodeCare

Continue to:

What is NodeCare?

NodeCare is the hardware early warning in PeakNode. 22 rules evaluate vendor values and the history of every component and report, for example, a drive that will soon be full if the trend continues, a GPU that runs hotter at the same power, or rising memory errors.

Does NodeCare cost extra?

No. NodeCare is included in every PeakNode plan, including the free Proof of Concept. There, because of the 14-day data retention, the temperature comparison with its own history is not available; the other rules apply.

Does NodeCare detect when a GPU will fail?

No. NodeCare gives no failure probability and no remaining lifetime. It reports what the driver and the kernel log say about the card and how its values change compared with its own history. Only the fill level of drives is projected, with the calculation shown.

How does NodeCare calculate when a drive will be full?

With a linear projection over the daily means of usage for the last 30 days, once 7 days of data are available and only with an increase of 0.02 percentage points per day or more. Full within 30 days at most means “Plan maintenance”, within up to 12 months “Watch”. The thresholds of 85% and 95% apply immediately, without a learning phase.

When does NodeCare notify, and when not?

“Act now” goes immediately to the server monitor’s channels, “Plan maintenance” once a day at 08:00 and only for new items. “Watch” does not create a message. GPU items are only sent if “Alert on hardware events” is switched on for the server monitor. If hardware health reports the same event, only its message is sent.

What is in the warranty claim (RMA) record?

Server monitor, GPU, model, UUID, PCI address and driver version, the ECC counters since the driver was loaded and over the lifetime, the state of remapped rows, the Xid events of the last 30 days and the corrected ECC errors per day. You enter the serial number by hand; the agent does not provide it.

Which hardware does NodeCare not cover?

NodeCare evaluates memory errors (EDAC), drive health and wear (SMART), power supplies and fans (BMC) and the CPU temperature as soon as the Linux agent version 11 or later provides them. If a system has no such source, the rule remains without data. On Windows the agent provides neither ECC nor PCIe nor Xid, so the related rules remain without data there. The temperature comparison needs 14 days of history and a data retention of at least 21 days. NodeCare does not replace a diagnosis by the vendor.

How do I read SMART values on a server?

On Linux with smartctl -a from the smartmontools package, for NVMe drives also with nvme smart-log. The PeakNode agent version 11 or later reads the values every 30 minutes through smartctl, or nvme-cli as a fallback, without waking sleeping drives. NodeCare evaluates health, wear, spare and media errors from them. If these tools or python3 are missing, the drive rules stay without data; the agent installs nothing.

Does NodeCare read IPMI or BMC sensors?

Yes, if ipmitool is installed and the server’s BMC is reachable over IPMI. The Linux agent version 11 or later reads power supplies, fans, inlet temperature and power every 3 minutes, and NodeCare reports a failed power supply or fan as “Act now”. Without a BMC, fan speeds come from hwmon. The HGX server page shows how this looks on an 8-GPU system.
Know what needs maintenance next

Create an account, create a server monitor, install the agent. NodeCare evaluates from the first report and is included in every plan.